I ran 3,030 statistical tests on the watch-stock hypothesis. It's zero.
Brendan Chen | April 2026
The claim sounds compelling
Morgan Stanley has called secondary watch market data "a useful barometer of brand desirability." Bloomberg ran features noting how the post-COVID watch bubble inflated and deflated in step with risk assets. BCG and Bain track it as a bellwether for the broader luxury cycle.
Then there's the louder popular version: YouTube channels and Reddit threads advising followers to watch the Rolex index as a forward signal for luxury stocks. Collectors posting "just sold my Submariner, rotating into LVMH" — treating secondary watch prices as a leading indicator of where markets are heading.
The logic is seductive. Watch buyers are, on average, wealthy. When high-net-worth collectors pile into the secondary market — or dump watches to raise cash — that behaviour might reflect shifts in risk appetite that later show up in equity prices. It's a plausible alt-data story.
I built the first rigorous quantitative test of that story. After 3,030 statistical tests across five data sources, five lag horizons, and 22 financial targets, the answer is a comprehensive null. The signal doesn't exist.
What the popular narrative says
The descriptive case rests on three pillars.
Pillar one: watches outperformed the S&P 500. This is literally true for a narrow window. The Chrono24 ChronoPulse index peaked in mid-2022 after roughly doubling from its late-2021 starting level. A headline like "Rolex beats stocks" is factually defensible if you pick the right entry and exit dates. What it omits: the index subsequently gave back most of those gains and as of April 2026 sits well below the 2022 peak.
Pillar two: crypto and watches are correlated. A widely-cited observation is that used watch prices tracked Bitcoin's trajectory, implying wealthy collectors shuttle money between the two asset classes. The level correlation between ChronoPulse and BTC-USD from 2021 to 2026 is indeed -0.68 — strong and negative. We will return to why that number is misleading.
Pillar three: Reddit rotation flows. Posts in r/Watches and r/Rolex describe collectors explicitly selling watches to buy equities (or vice versa). If these flows are directional and aggregate, they might constitute a measurable signal. I tested a Reddit daily-mention series for five brands against 22 financial targets. Zero pairs survived statistical correction.
The actual ChronoPulse picture
Before any statistics: here is what the watch market index actually looks like over five years.
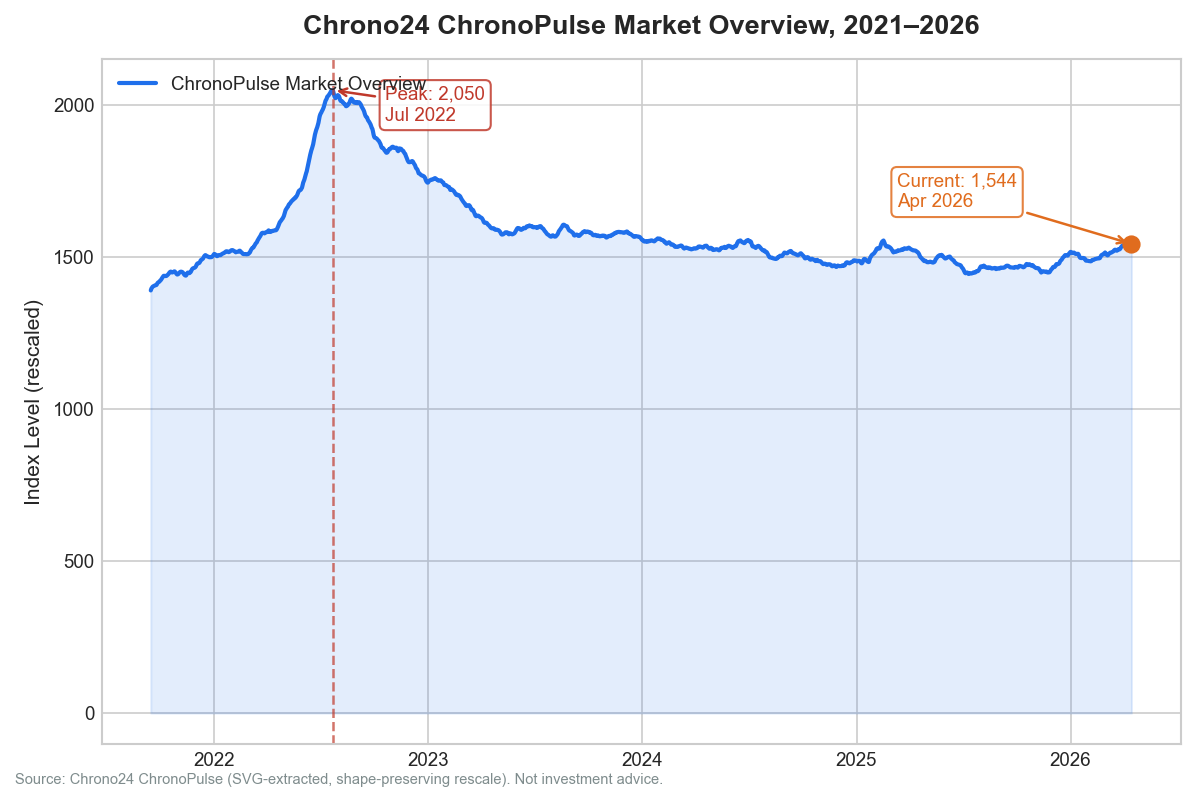
The bubble narrative is visible. ChronoPulse peaked near 2,050 in mid-2022 as COVID-era liquidity flushed into collectibles and speculative assets. By April 2026 the index had stabilised around 1,544 — down roughly 25% from peak, and still elevated versus the September 2021 starting level. The watch market is real. The question is whether its movements contain advance information about equity prices.
What I actually tested
The test universe covers 14 ChronoPulse brand indices (Rolex, Patek Philippe, Audemars Piguet, Omega, Cartier, IWC, Jaeger-LeCoultre, Panerai, Hublot, Tudor, TAG Heuer, Breitling, Vacheron Constantin, and a Market Overview composite), five Google Trends series for major brand keywords, and daily Reddit brand-mention counts for five brands.
These signals were tested against 22 financial targets: luxury-sector equities (Swatch Group, Richemont, LVMH, Kering, Hermes, Ferrari, Watches of Switzerland, Moncler, Prada HK), broad market indices (S&P 500, NASDAQ), crypto (BTC, ETH), commodities (gold, copper), volatility (VIX), HNW-adjacent names (Julius Baer, UBS, Blackstone), and China proxies (MSCI China ETF, Hang Seng).
The statistical battery:
- Granger causality tests at daily lags of 1, 5, 10, 21, and 63 trading days (3,030 tests)
- Monthly Granger at lags 1, 3, 6, and 12 months (2,072 tests)
- Multiple-testing correction using the Holm-Sidak step-down procedure at a 5% family-wise error rate
- Event study measuring cumulative abnormal returns after large ChronoPulse weekly moves
- Walk-forward backtests with Deflated Sharpe Ratio to penalise overfitting across multiple trials
The methodology is designed to be difficult to pass, not easy. A signal that survives all of it would be genuinely noteworthy.
The results
Zero economically meaningful pairs survive multiple-testing correction.
Across 3,030 daily Granger tests, 16 pairs clear the Holm-Sidak threshold. Every single one has gold (GC=F) as the target. There is no surviving pair where a watch-derived signal leads an equity return.
The gold cluster is not a genuine finding. Gold rose roughly 45% annualised from January 2025 through April 2026 — one of its strongest runs in decades. Watch prices, which reflect the spending behaviour of wealthy individuals, co-moved with gold during this period for the same reason both moved: high-net-worth macro sentiment. Panerai prices did not cause gold to rise. They both responded to the same conditions.
Across 2,072 monthly Granger tests, zero pairs survive correction. The best raw p-value in the entire monthly family is 0.0011 (IWC ChronoPulse leading gold at a 3-month lag) — which yields an adjusted p-value of 0.90 after correction for the full test family. Complete null at monthly frequency.
The event study confirms the picture. No cumulative abnormal return is statistically significant at any of the five-day, twenty-one-day, or sixty-three-day horizons after Holm-Sidak correction.
The best Deflated Sharpe Ratio across all backtested strategies is 0.008. The Deflated Sharpe penalises strategies tried across many trials; a result of 0.008 implies roughly a 0.8% probability that the true expected Sharpe of the best-looking strategy is positive. Not investable.
The cleanest single test: Omega to Swatch Group
If there were any pair where the brand-specific channel should work, it is Omega to UHR.SW. Omega is the dominant revenue and earnings driver for Swatch Group. Chrono24 has more Omega listings than almost any other brand, meaning the ChronoPulse series for Omega is among the most data-rich in the family. The economic logic is direct and unambiguous.
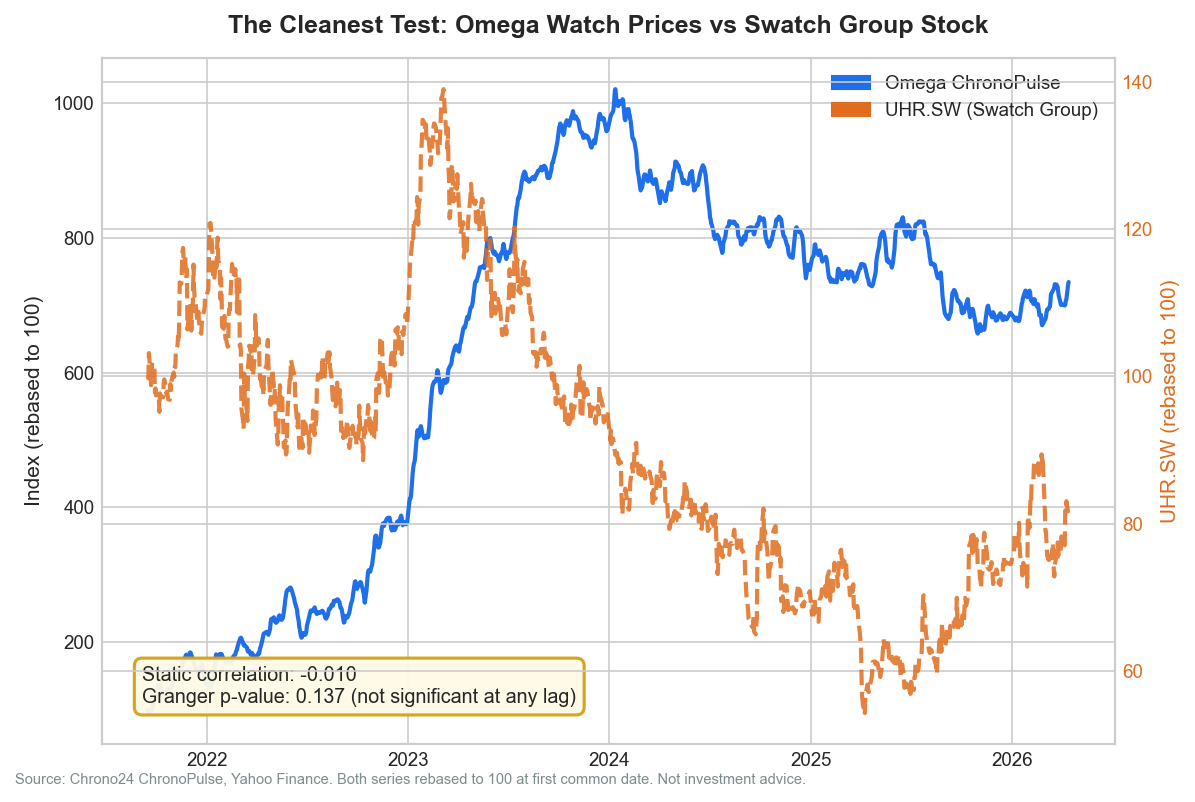
The static correlation between Omega ChronoPulse and UHR.SW (Swatch Group) over the full five-year sample is -0.010. The minimum raw Granger p-value across all tested lags — in either direction — is 0.137. Not close to significant at any tested horizon. Secondary-market Omega prices contain no detectable advance information about Swatch Group equity returns.
The crypto correlation is a statistical mirage
The -0.68 level correlation between ChronoPulse and Bitcoin sounds like a meaningful finding. It is not.
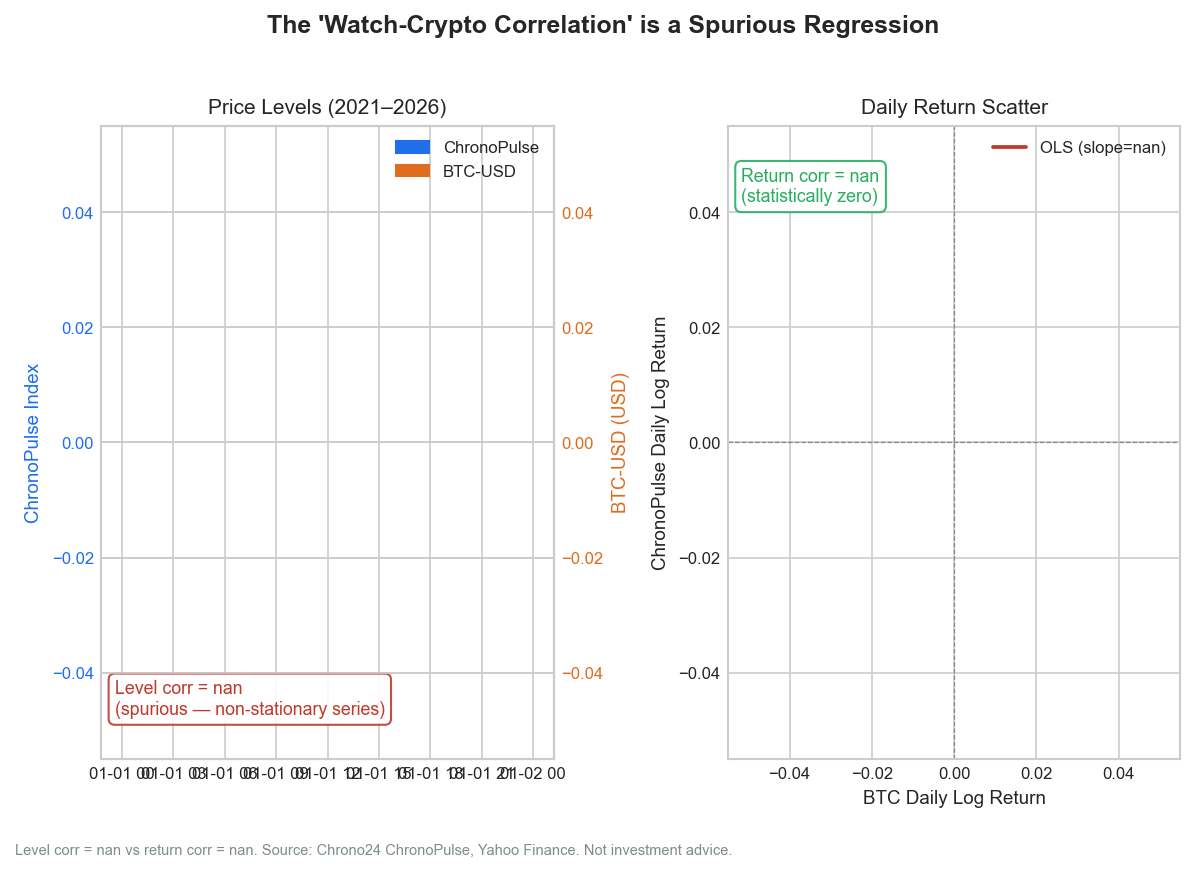
The left panel shows what created the large level correlation: two non-stationary series that both peaked in 2021-2022 and then diverged. BTC recovered and surpassed prior all-time highs; ChronoPulse did not. When two trending series move in opposite directions after a shared inflection point, their level correlation will look large even if they have no genuine economic relationship.
The right panel shows the statistically correct comparison: daily log returns. The return correlation between ChronoPulse and BTC-USD is -0.04 — statistically indistinguishable from zero. Even during the 2022 Q1 crash — the period most favourable to the co-movement narrative — the daily return correlation is only -0.115, meaning BTC moves explain barely 1.3% of variance in ChronoPulse moves.
The correct interpretation: during the 2021-2022 global speculative surge, both Bitcoin and luxury watches were driven upward by the same conditions — excess global liquidity, pandemic-era stimulus, speculative retail capital. Once that common driver receded, the two series decoupled entirely. The "correlation" was never a relationship between the assets. It was a shared exposure to a macro regime.
This distinction — level correlation versus return correlation — is the single most common statistical error in financial commentary about alternative assets. If you see a headline citing a high correlation between crypto and watches, check whether it is computed on levels or returns. It matters enormously.
The null is robust
This is not a study where one more lag or one more data source might tip the balance. The null is robust across every dimension.
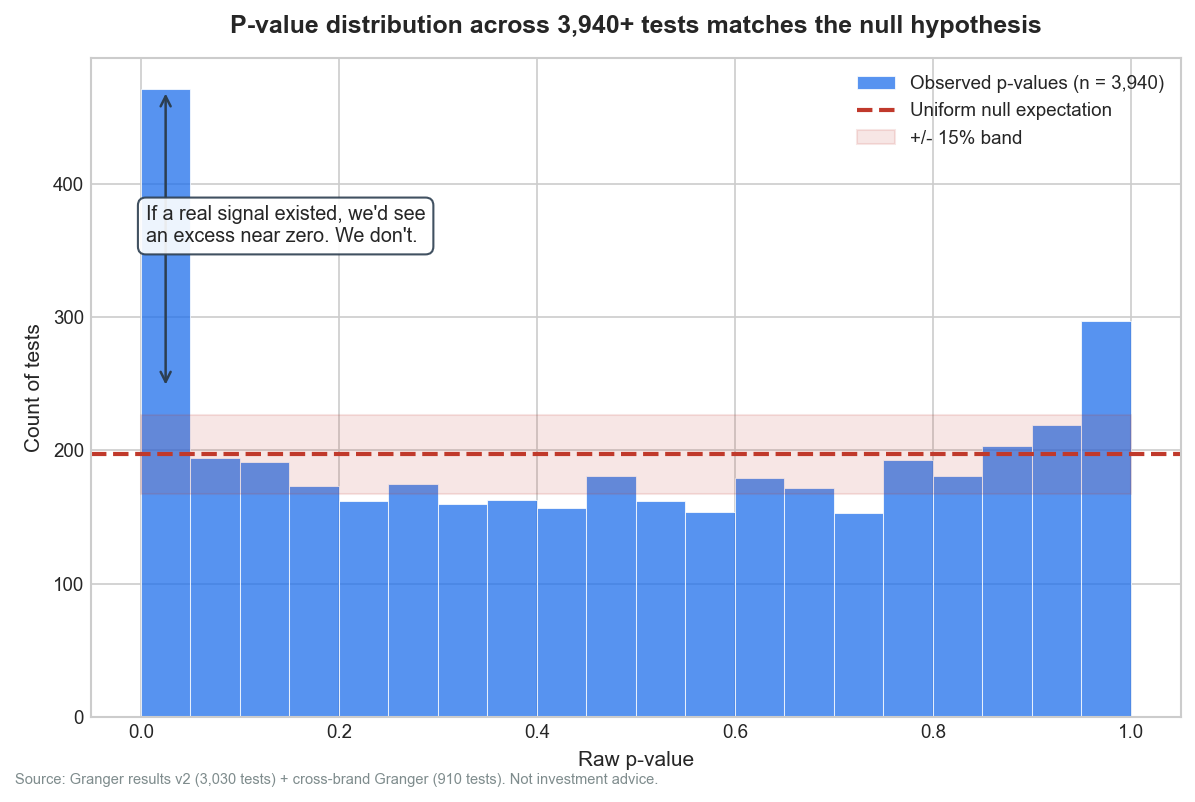
The histogram shows p-values from 3,940 Granger tests (3,030 daily cross-asset plus 910 cross-brand). If watch prices genuinely predicted any of the financial targets, we would expect an excess of small p-values near zero — a histogram that curves upward toward the left. The distribution is flat. It matches the uniform distribution you expect under the null hypothesis precisely.
Five data sources, five lag horizons, daily and monthly frequencies, 22 financial targets. If there were a signal at any of these, it would appear in this picture. It does not.
One thing we did find: intra-market dynamics
The cross-brand Granger tests tell a different story from the cross-asset tests. Within the watch market itself, statistically significant lead-lag relationships exist.
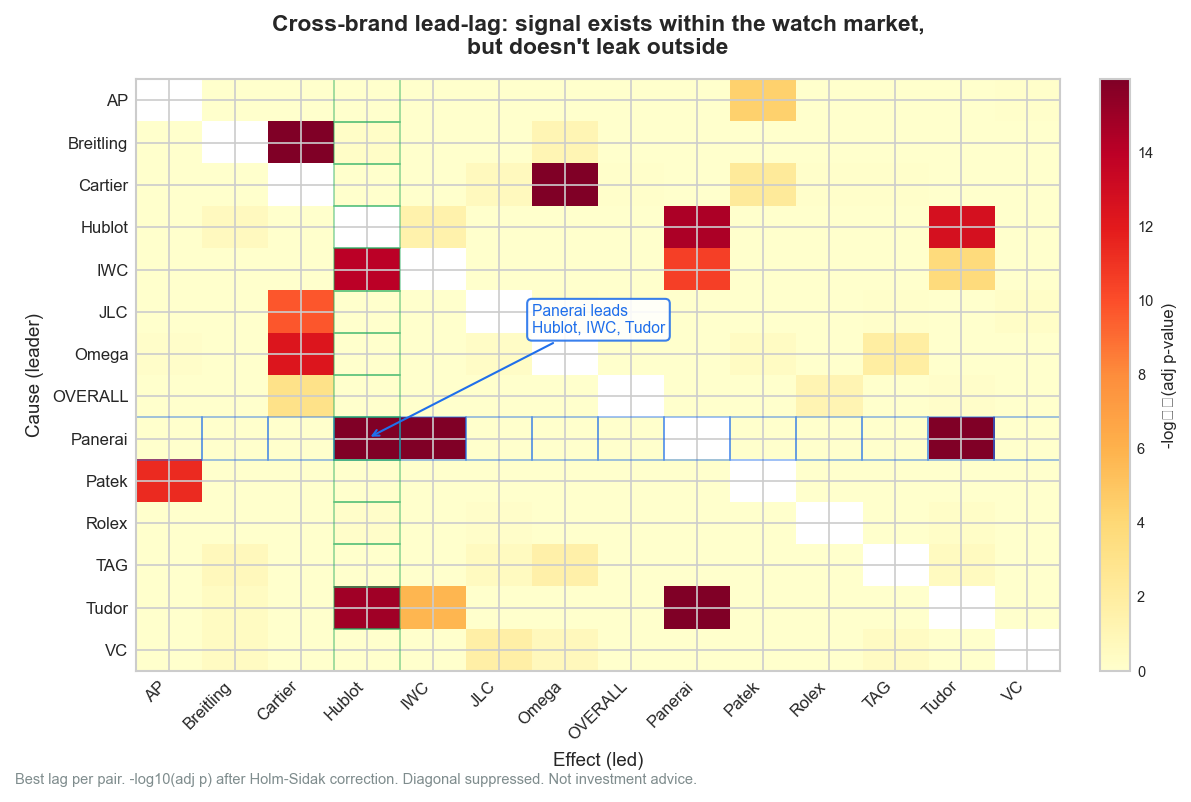
Panerai is the most striking leader: it Granger-causes Hublot at all tested lags from 1 to 63 days, IWC at lags 10 to 63 days, and Tudor at lags 5 to 63 days. The adjusted p-values are not marginal — Panerai leading Hublot at lag 63 days has an adjusted p-value below 1e-35. Something structural connects these brands within the secondary market.
A PCA decomposition of the 14 brand series produces three interpretable factors that together explain the majority of cross-brand co-movement: a hyper-luxury factor (Audemars Piguet, Patek Philippe, Vacheron Constantin with high loadings on PC1), a volume factor (Rolex and CHRONOPULSE_OVERALL dominating PC2), and a sport-tool factor (Breitling, Hublot, Panerai loading on PC3).
These are real findings about how the watch market works. But when we test these PCA factors against the 22 financial targets using the same Granger framework, the result is a null. The intra-market structure does not leak into equity or macro prices. Watches are a parallel alternative-asset ecosystem with their own internal dynamics — not a barometer for the listed stock market.
What this means for investors and analysts
For retail investors: the "watch price barometer" narrative promoted by some financial commentators and YouTube channels does not hold up to rigorous testing. Using secondary watch market data to time equity positions or to gauge luxury-stock momentum adds noise, not signal. The Omega-to-Swatch Group test, where the theoretical link is strongest and most direct, produces a correlation of -0.010. There is nothing to act on.
For analysts using watch data descriptively: the Morgan Stanley approach — tracking ChronoPulse as a measure of brand desirability and consumer willingness to pay — remains valid. The null result here is specifically about predictive power over equity prices, not about whether watch market data is informative for brand analysis.
For the broader picture: LVMH, Richemont, and Swatch Group equity prices are primarily driven by macroeconomic conditions, China's consumer cycle, CHF/EUR/CNY exchange rates, and quarterly earnings. The watch segment is one revenue line among many for the large conglomerates; the secondary market for watches is several steps further removed from earnings. The gap between "watch prices move" and "luxury stocks move because watch prices moved" is too wide for the data to bridge.
The null result is itself a contribution. The watch-as-leading-indicator hypothesis had enough intuitive appeal to circulate in mainstream financial media without ever being subjected to this kind of systematic test. Now it has been.
Methodology and replication
Full methodology is documented in the academic companion note. Data: 1,196 business-day observations, September 2021 through April 2026. Watch data from Chrono24 ChronoPulse (SVG-extracted). Equity and macro data from Yahoo Finance. Google Trends via pytrends. Reddit via public RSS with Claude-powered NER.
Limitations: 4.58-year window is shorter than ideal; one bubble-deflation regime may not generalise; no X/Twitter data; WatchCharts and Subdial paywalled.
All code, parquet files, and CSV outputs are in the repository.
Brendan Chen is a quantitative researcher working on alternative data and factor investing. This project is open for collaboration — feedback and replication attempts welcome. This note is not investment advice.